
Patient satisfaction surveys are theoretically good things. After all, hospitals and doctors should know what their patients think about them. If a service is not performing well, the results of a patient satisfaction survey would be useful in helping us make improvements. This would be true if patient satisfaction could be measured in a meaningful way. In a previous blog, I explained some of the statistical problems with all patient satisfaction surveys.
Here’s an example of the current state of the art and why these surveys are useless.
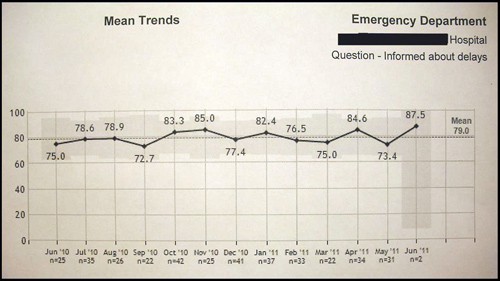
A hospital posted the above graphic. As provided by a leading company, it shows the trend of patient satisfaction scores for the question “Were you informed about the causes of delays during your emergency department [ED] visit?”
You can see that the scores fluctuate around the average score of the 79th percentile for the year, meaning that 21% of comparator hospitals fared better on this question.
This ED receives more than 25,000 visits per year, or over 2000 visits per month. The number of responses to the survey questionnaires ranged from a low of 2 in June of that year to a high of 42 in October of the year before. This represents a range of 0.1% to 2.1% of all ED visits — far below what even a non-statistician would recognize as a reasonable sample.
Despite efforts to improve scores for this question, no significant change has occurred.
What does it all mean? If you look at the trend line, you will note that it mirrors what occurs in a feedback loop. [Digression: A thermostat is a classic example of a feedback loop in action. If you set the thermostat for 70 degrees, the temperature will fluctuate about that point. Most of the time it will not be 70 degrees in the room as the furnace will run until the temperature is 70 and when the furnace shuts off the temperature will overshoot. Likewise when the temperature falls below 70, it will take time for the furnace to warm the room back up. (Ref. GJS Wilde, Target Risk 2, PDE Publications, Toronto 2001)]. This feedback loop phenomenon has been blogged about on Smartlyheated.com as a classic reaction to the posting of such scores. When the scores fall, task forces are formed and meetings are held. A slight improvement is often seen. [Hawthorne effect: Performance improves when subjects are aware they are being watched.] But once the scores improve, everyone goes back to business as usual and the scores drop again.
And don’t forget, the next month’s responses will not reflect what a task force will do this month, as there is a time lag of at least a few weeks for surveys to be sent and returned.
It’s too bad that the 87.5 percentile score was achieved when the response to the questionnaire was a mere 2 patients.
What do you think happened to the score the next month?
Skeptical Scalpel is a recently retired surgeon and was a surgical department chairman and residency program director for many years. He is board-certified in general surgery and a surgical sub-specialty and has re-certified in both several times. For the last two years, he has been blogging at SkepticalScalpel.blogspot.com and tweeting as @SkepticScalpel. His blog averages 800 page views per day, and he has over 4500 followers on Twitter.
 SkepticalScalpel