
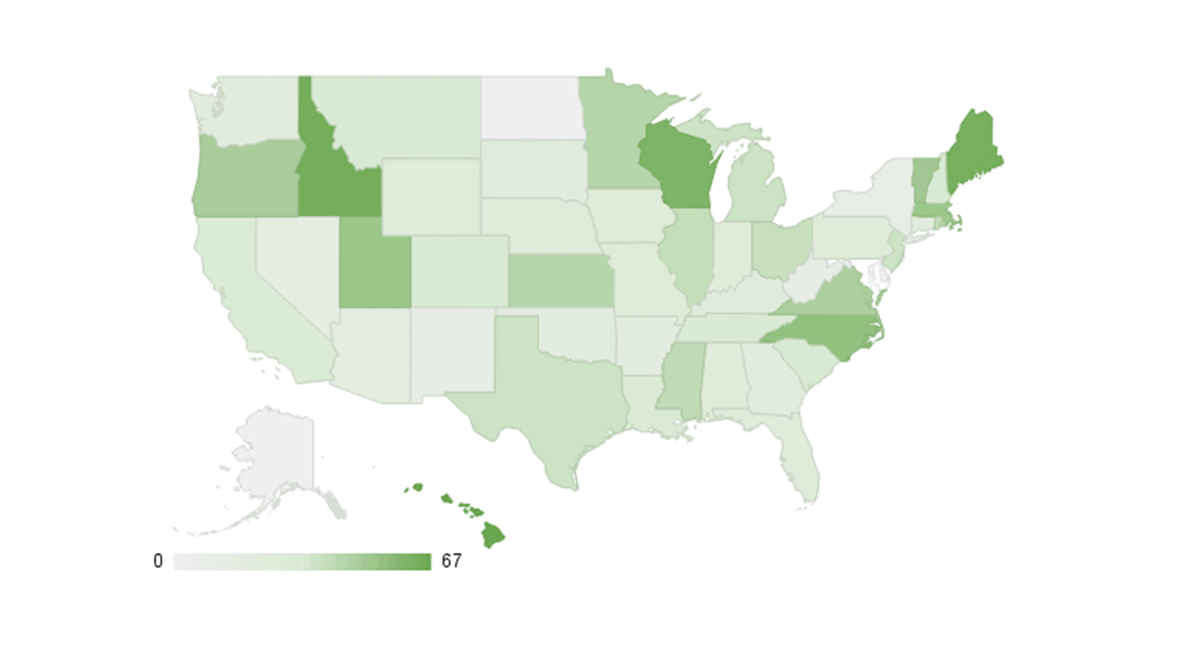
States that are shown in a darker green have a higher percentage of “A” hospitals. Does your state make the grade? Hospitals across the country show a lot of variation when it comes to patient safety.
Hospital safety breakdowns, including patient injuries, accidents and infections, kill over 200,000 Americans each year, making these errors the third leading cause of death in the U.S. But not all hospitals are alike. The Leapfrog Group today announced its Fall 2016 release of the Leapfrog Hospital Safety Grade, a program which assigns A, B, C, D and F letter grades to more than 2,600 U.S. hospitals bi-annually and is the gold standard measure of patient safety in the United States. Of the 2,633 hospitals evaluated, 844 earned an “A,” 658 earned a “B,” 954 earned a “C,” 157 earned a “D” and 20 earned an “F.”
When ranked by percentage of hospitals earning an “A,” several states stood out for significant improvements over time. North Carolina has climbed from number 19 in the country in the Spring 2013 Safety Grade to number five in the Fall 2016 Safety Grade. Idaho has also made continuous strides, moving from number 45 in Spring 2013 to number two in Fall 2016.
Other states with notable improvements include Utah, ranked number six in the Fall 2016 Safety Grade, and Vermont, ranked number eight. For the first time, the top ranked state is Hawaii, while the bottom-ranked states, each with no “A” hospitals, are Alaska, Delaware and North Dakota, along with Washington, D.C.
Here, states are ranked based on the number of “A” hospitals they have compared to the total number of hospitals that operate in that state.
Search for individual hospitals here.
Note: Maryland is not ranked because hospitals are not required to publicly report their hospital safety data.
| Rank | State | Total # Hospitals Scored |
Total # A Hospitals |
% A Hospitals |
|---|---|---|---|---|
| 1 | Hawaii | 12 | 8 | 66.7% |
| 2 | Idaho | 11 | 7 | 63.6% |
| 3 | Maine | 16 | 10 | 62.5% |
| 4 | Wisconsin | 57 | 35 | 61.4% |
| 5 | North Carolina | 78 | 43 | 55.1% |
| 6 | Utah | 23 | 12 | 52.2% |
| 7 | Massachusetts | 60 | 31 | 51.7% |
| 8 | Vermont | 6 | 3 | 50.0% |
| 9 | Oregon | 33 | 16 | 48.5% |
| 10 | Virginia | 66 | 31 | 47.0% |
| 11 | Minnesota | 36 | 16 | 44.4% |
| 12 | Kansas | 32 | 14 | 43.8% |
| 13 | Mississippi | 37 | 15 | 40.5% |
| 14 | Rhode Island | 10 | 4 | 40.0% |
| 15 | Illinois | 113 | 45 | 39.8% |
| 16 | Ohio | 110 | 43 | 39.1% |
| 17 | Texas | 212 | 78 | 36.8% |
| 17 | New Jersey | 68 | 25 | 36.8% |
| 19 | Michigan | 79 | 29 | 36.7% |
| 20 | South Carolina | 47 | 16 | 34.0% |
| 21 | Montana | 9 | 3 | 33.3% |
| 21 | New Hampshire | 12 | 4 | 33.3% |
| 23 | Colorado | 43 | 14 | 32.6% |
| 24 | Tennessee | 66 | 21 | 31.8% |
| 25 | Louisiana | 49 | 15 | 30.6% |
| 26 | California | 267 | 81 | 30.3% |
| 27 | Missouri | 59 | 17 | 28.8% |
| 28 | Alabama | 53 | 15 | 28.3% |
| 29 | Iowa | 32 | 9 | 28.1% |
| 30 | Wyoming | 8 | 2 | 25.0% |
| 31 | Pennsylvania | 131 | 32 | 24.4% |
| 32 | Florida | 173 | 42 | 24.3% |
| 33 | Indiana | 63 | 15 | 23.8% |
| 34 | Nebraska | 17 | 4 | 23.5% |
| 35 | Kentucky | 52 | 12 | 23.1% |
| 36 | South Dakota | 9 | 2 | 22.2% |
| 36 | Georgia | 72 | 16 | 22.2% |
| 36 | Connecticut | 27 | 6 | 22.2% |
| 39 | Oklahoma | 39 | 8 | 20.5% |
| 40 | Washington | 46 | 9 | 19.6% |
| 41 | Arkansas | 28 | 5 | 17.9% |
| 42 | Arizona | 49 | 8 | 16.3% |
| 43 | Nevada | 20 | 3 | 15.0% |
| 44 | New Mexico | 16 | 2 | 12.5% |
| 45 | West Virginia | 25 | 3 | 12.0% |
| 46 | New York | 138 | 15 | 10.9% |
| 47 | Alaska | 5 | 0 | 0.0% |
| 47 | Delaware | 6 | 0 | 0.0% |
| 47 | District of Columbia | 7 | 0 | 0.0% |
| 47 | North Dakota | 6 | 0 | 0.0% |